Data structures and algorithms have the highest dropout rate of any computer science course. Not because the concepts are impossibly difficult — but because the way they're usually taught makes them feel impossibly abstract.
You read about a linked list. You draw boxes with arrows on paper. You write code that seems to work. Then you get to an interview or an exam and draw a complete blank.
That's not a talent problem. That's a visualization problem. Data structures are fundamentally visual concepts being taught as text. This guide is about fixing that.
Why the Standard Approach Fails
Most people who struggle with DSA are struggling because nobody gave them a real framework — not just a problem list, but a way to think, progress, and stay consistent without burning out.
The typical approach looks like this: read a chapter, copy some code, move on. The problem is that understanding a data structure from code alone is like understanding a city from its street addresses. Technically correct, completely useless for navigation.
Topics in data structures and algorithms are dependent on each other, and programmers often learn concepts in a complex order — sometimes learning advanced topics before learning fundamentals. This creates gaps that compound as complexity increases.
The fix isn't working harder. It's changing what you look at when you learn.
The Right Order to Learn DSA
Before anything else, get the sequence right. Most courses get this wrong.
Start here:
- Arrays — the foundation of everything else
- Strings — arrays of characters, same mental model
- Stacks and Queues — built from arrays, introduce LIFO and FIFO logic
- Linked Lists — first pointer-based structure, teaches dynamic memory thinking
- Hash Maps — introduces key-value lookup, O(1) access
- Trees — first non-linear structure, recursive thinking starts here
- Binary Search Trees — trees with ordering property
- Graphs — generalization of trees, most complex structure
- Sorting Algorithms — applied across all of the above
- Dynamic Programming — last, after you can think recursively
Trees and graphs account for roughly 30% of interview questions — spend extra time here. Build intuition for when to use BFS vs DFS: BFS for shortest path in unweighted graphs, DFS for exhaustive search and backtracking.
Skipping ahead is the single most common mistake. You cannot understand trees without linked lists. You cannot understand graphs without trees. The sequence matters.
The Visualization Approach That Actually Works
For each new data structure, follow this sequence before writing a single line of code:
Step 1 — Watch it move Before reading the definition, watch an animation of the structure in action. Watch elements being inserted, deleted, and searched. Let your brain form a spatial model first.
Step 2 — Predict the next step Pause the animation before each operation completes. Predict what will happen. Where will the new element go? Which pointer changes? What does the memory look like after the operation?
Step 3 — Trace through manually Draw it on paper. Not code — boxes and arrows. Insert five elements by hand. Delete one. Search for one. If you can do this on paper, you understand the structure.
Step 4 — Then write the code Only after steps 1-3 does the code make sense. Now the code is just expressing what you already understand visually.
Step 5 — Animate your own code Run your implementation and watch it execute. If something breaks, you'll see exactly where — because you have the mental model to know what should have happened.
This approach is slower than jumping straight to code. It's also the only one that actually works.
Key Data Structures — What to Actually Understand
Arrays
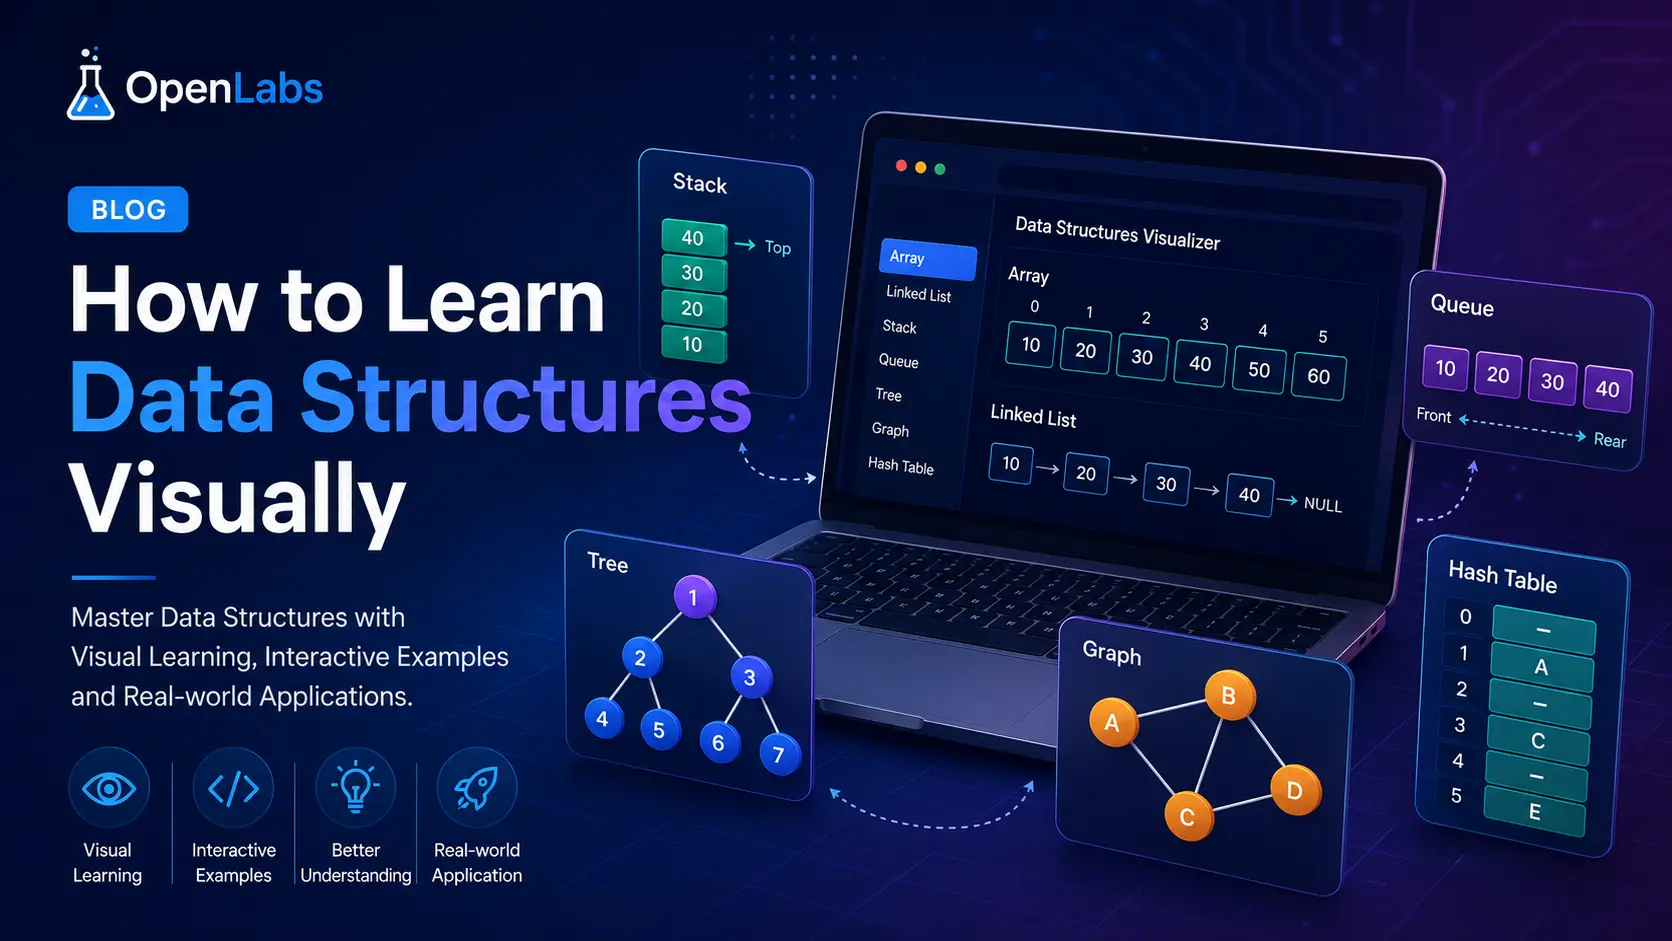
The simplest structure and the one most people think they already understand. What most students miss: why random access is O(1) but insertion at the middle is O(n). The answer is memory layout — elements are stored contiguously, so the computer can calculate any element's address instantly, but shifting elements for insertion requires touching every subsequent element.
What to visualize: elements laid out in a straight line in memory, indices as addresses.
Linked Lists
The first structure that doesn't rely on contiguous memory. Each element (node) contains data and a pointer to the next node. Insertion at the head is O(1) — you just create a new node and point it to the old head. But finding element 50 requires traversing 49 nodes first — O(n) search.
What to visualize: a chain of boxes connected by arrows. Inserting is rewiring an arrow, not shifting a row.
Stacks and Queues
These are restrictions on how you access a list, not different underlying structures. A stack is LIFO — last in, first out, like a stack of plates. A queue is FIFO — first in, first out, like a queue at a counter.
What to visualize: plates stacking up (stack) vs people lining up (queue). The operation that makes sense in the analogy is the right operation.
Hash Maps
The data structure that makes O(1) lookup possible. A hash function converts a key (like a string) into an index, then stores the value at that index in an array. The magic is in the hash function — and the complexity is in handling collisions when two keys map to the same index.
What to visualize: a post office where the hash function calculates which box your letter goes in. Collisions are two letters assigned to the same box.
Binary Search Trees
A tree where every node's left child is smaller and every right child is larger. This property makes search O(log n) — at each node you eliminate half the remaining tree.
What to visualize: a decision tree. At each node you ask "is my value less than or greater than this?" and go left or right accordingly.
Sorting Algorithms
This is where visualization makes the biggest difference. The difference between bubble sort (O(n²)) and merge sort (O(n log n)) is invisible in text and obvious when animated.
- Bubble sort: adjacent elements swap if out of order, repeated until sorted. Watch the largest element "bubble" to the end with each pass.
- Merge sort: divide the array in half recursively until you have single elements, then merge sorted halves. Watch it split apart and reassemble.
- Quick sort: pick a pivot, partition elements around it, recurse. Watch the pivot find its correct position while everything rearranges.
Using the OpenLabs DSA Visualizer
The OpenLabs DSA Visualizer animates all of these structures and algorithms in real time. Here's how to use it effectively:
For data structures:
- Use the step-by-step mode, not the full animation — pause at each operation and predict what comes next before it happens
- Try insertions, deletions, and searches in sequence on the same structure
- Change the input data and repeat — the pattern should be the same regardless of what you insert
For sorting algorithms:
- Run the same dataset through bubble sort, merge sort, and quick sort in sequence
- Watch the number of operations — the difference in efficiency becomes visceral, not theoretical
- Try a nearly-sorted dataset vs a completely random one — some algorithms behave very differently
For the JavaScript Event Loop Visualizer (CS-specific):
- This shows how JavaScript manages asynchronous operations — call stack, web APIs, microtask queue, macrotask queue
- Use Predict Mode: try to guess the execution order before running the code
- This is one of the most common sources of confusion in JavaScript development and one of the hardest things to understand from text alone
Open the DSA Visualizer on OpenLabs — free, no download.
The Practice Method That Actually Sticks
Solving a problem once is not enough. You need to come back to it. Mark problems that gave you trouble. Revisit them after three to five days. Try solving them again from scratch without looking at your previous approach. If you can solve it cleanly, you have actually learned it. If you cannot, you know you need more work there.
Here's the weekly structure that works:
Day 1 — Learn a new structure visually (watch, predict, trace on paper)
Day 2 — Implement it from scratch without looking at reference code
Day 3 — Solve 2-3 problems using it
Day 4 — Revisit a structure from last week — can you still trace it on paper?
Day 5 — One harder problem combining two structures
Consistency beats intensity: 1-2 problems daily for 3 months outperforms weekend cramming. Use spaced repetition to review solved problems and retain patterns long-term.
The daily challenge feature on OpenLabs generates fresh DSA challenges every day. This is the closest thing to daily spaced repetition practice that exists in an interactive visual environment.
What to Stop Doing
Stop watching solution videos immediately. Watching someone else solve a problem teaches you nothing about solving problems. Watch after you've genuinely attempted it yourself.
Stop memorizing code. Memorized code evaporates under pressure. Understanding why the code is structured the way it is — based on the visual model — stays.
Stop skipping fundamentals. Dynamic programming seems impossible until recursion is comfortable. Graphs seem impossible until trees are comfortable. The order is not optional.
Stop measuring progress by problems solved. Measure by how many structures you can trace on paper from memory. That's the real test.
The Honest Timeline
With consistent daily practice using visualization first:
- Arrays, strings, stacks, queues: 1-2 weeks
- Linked lists, hash maps: 1-2 weeks
- Trees and BSTs: 2-3 weeks
- Graphs: 2-3 weeks
- Sorting algorithms: 1 week
- Dynamic programming: 4-6 weeks
Total: 3-4 months to genuine competence, not surface familiarity.
It is a common misconception that data structures and algorithms are too complex or hard to master. They're not. They're abstract — which is a different problem entirely, and one that visualization directly solves.
Stuck on a specific data structure or algorithm? The AI assistant inside the lab can walk you through any concept step by step.